
LogicBlog
Read about the latest industry trends in the world of monitoring and what’s happening around LogicMonitor.
Subscribe to LogicBlog
Most Recent

accelerate growth / 02.07.24
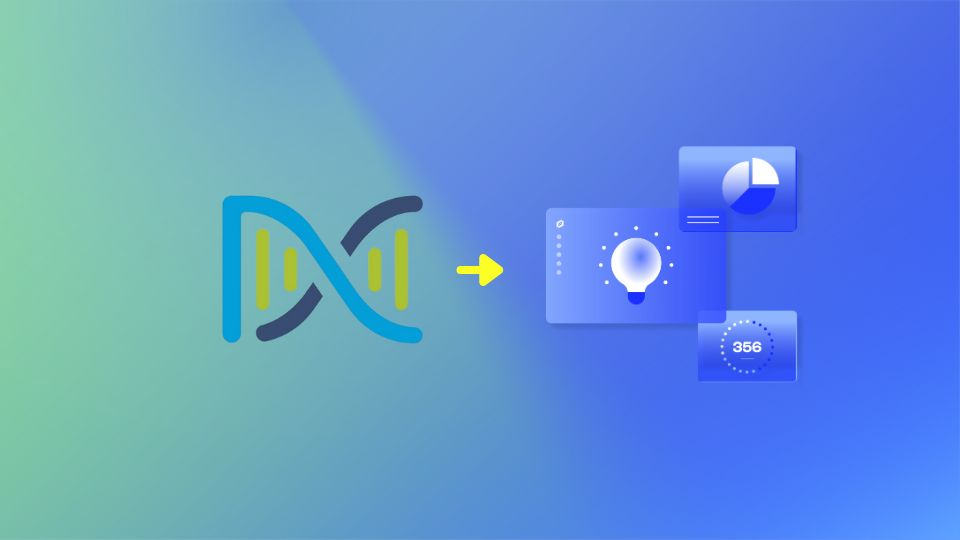
Why AI is crucial to your hybrid observability strategy: LogicMonitor’s latest innovations
Learn More
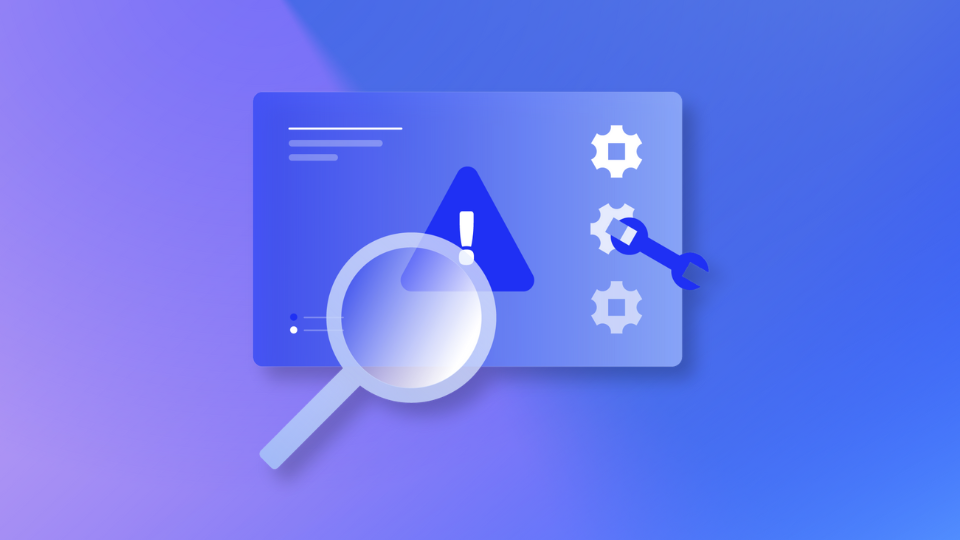
Cloud Monitoring / 12.20.23